
Introduction
An important tool for the creation of robust communications based systems is modeling and simulation (M&S). Modeling and simulation allows implementations and algorithms to be tested at a scale that might either be difficult, cost ineffective, or impossible to do with physical hardware. We needed an inexpensive graphical real time visualization tool that allowed us to evaluate system response timing in a M&S environment and a real time embedded system implementation. This would allow us to have confidence in the fidelity between the two implementations, so that the real time platform environment test results matched that of the M&S environment, and visa versa.
We could not at the time find an inexpensive tool that worked in both M&S and real time platform environments, so we created one. Therefore we developed internally a visual solution to the problem of observing OPNET simulation results, which occurs in simulation time (non-real time), to an actual deployment using OPNET created application code on a real time hardware platform.
Capabilities
RoboCom Network Visualizer, or RoboComNV, vastly improves evaluation and monitoring of complex wireless network systems.
- Fast and powerful visualization of communication simulation & implementation results.
- Easy to use and customizable graphical interface.
- Playback mode: records results for later analysis and demonstration.
- Streaming mode: immediate visual feedback of results for quick action.
Implementation
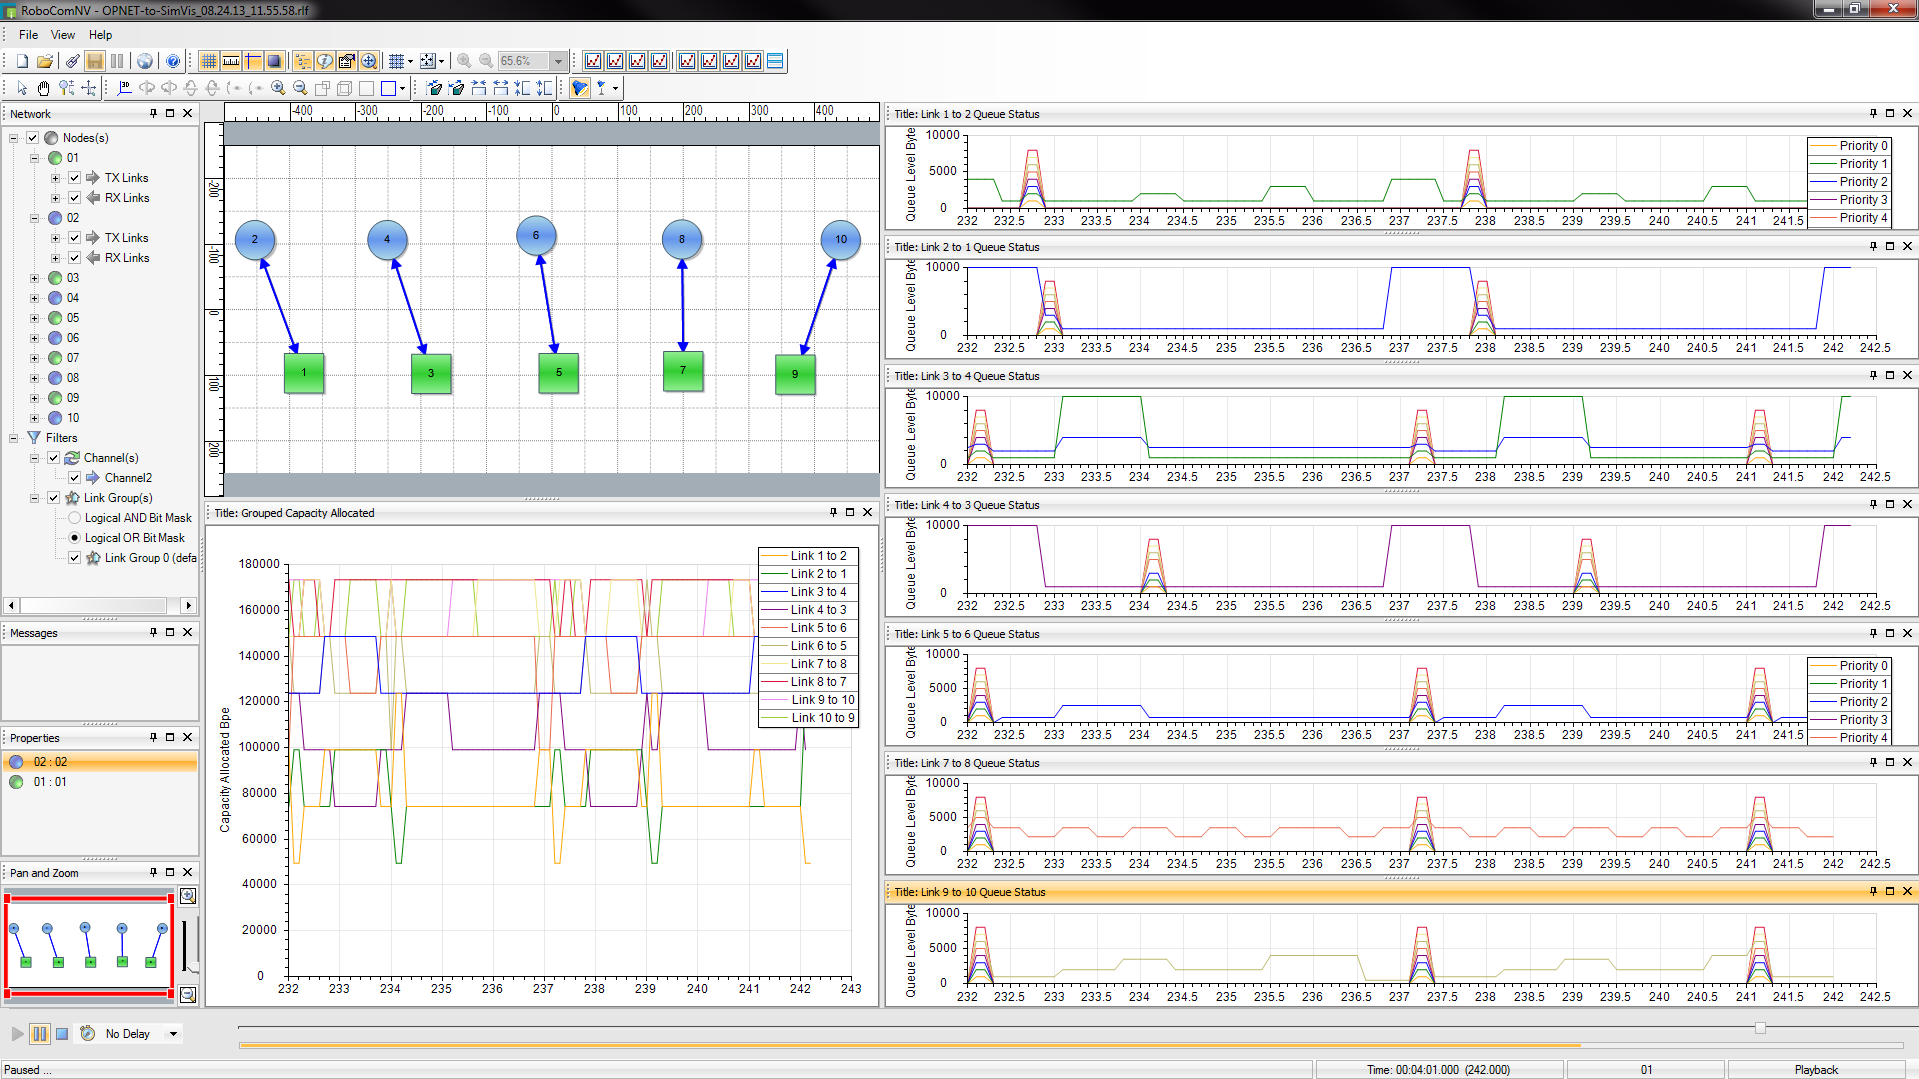
RoboComNV is a .NET/Windows client tool written in C# that provides network operators and analysts the capability to monitor the performance and status of a network system. This application displays content of data originating from a data source over a network connection. Results may be monitored in real-time streaming or playback mode from previously recorded network activities. The tool facilitates presentation of network performance related to node connectivity, network connectivity, traffic throughput and latency in a quickly comprehended and easily configured visual interface.
Common Output
Using RoboComNV as a common output visualization tool allows for measuring output from what can be very disparate hardware platforms and operating systems. This data sources can include communication modeling tools such as OPNET Modeler and MATLAB, customized software running on desktops, or embedded systems running on custom hardware. This allows for testing and comparing network performance between both simulation and real time environments.
Features
RoboComNV implements a blank “canvas” that is driven by a controlling application. It provides a two dimensional spatial layout of communications nodes that are created or deleted by the controlling application, connections between nodes, and includes node mobility. This application allows the controlling application to create and populate several 2D line charts. Therefore this tool can be used for different types of analysis, wherever nodes are connected together by some form of links.
RoboComNV is capable of displaying a wealth of different information associated with nodes, connections between nodes and timing data. RoboComNV does not inherently create data to display; rather, it displays content specified from an external source. The application maintains an internal database of data that it receives from the sending application. The user has the ability to subscribe to a particular set of data from a context menu for each chart. Exporting data to Excel is also provided in the chart context menu.
RoboComNV network visualization tool can be adapted for specific applications as needed. Furthermore, the software may be combined with other visualization tools from us to create a powerful suite of analysis tools.