
Introduction
We have decades of experience creating real time systems on embedded hardware using various real time operating systems (RTOS), preemptive and non-preemptive. Typically with the purchase of an RTOS are graphical visualization tools that show thread duty cycles, interrupts, and method profiling timing durations – the type of information necessary to evaluate the operating timeline of an embedded system and look for potential multi-threaded issues.
Embedded Linux
 Embedded Linux is rapidly replacing RTOS for many developments, and that has certainly been true for us as development engineers over the past decade. The challenge when developing under embedded Linux is to find an inexpensive graphical monitoring tool similar to what is available from a high priced RTOS. This is especially true of embedded Linux where there are challenges obtaining deterministic near real time behavior with either a generalized embedded Linux or stripped down or customized Linux operating system distribution.
The Problem
In a multi-threaded programming environment, how do we know what thread was active when, which thread preempted another thread, and when did the Linux kernel pend the entire application? Are priority inversions occurring, and how do we know?
If we only had the type of tools that FPGA developers have had for signal tracing, that might be enough. We needed a software logic analyzer to give us insight into the operation of our software under various test conditions.
Solution Requirements
Our requirements for an embedded visualization toolkit were as follows:
- We needed an inexpensive graphical trace tool that could be used across various platforms, embedded Linux, desktop Linux, Window, embedded Windows, or OPNET simulation environments.
- We needed a tool that would allow us to instrument our application code in a manner that did not introduce multi-threaded issues into the instrumented applications, so a non-locking non-blocking implementation was desired.
- The instrumentation needed to provide the ability to save time durations and discrete values as a function of time supporting mixed signal digital and analog representations with microsecond precision.
- Support data acquisition from multiple threads with a very low CPU and memory footprint.
- Support instrumenting both C and C++ native code based applications.
As the proverb describes,“necessity is the mother of invention”. We could not find such a tool, so we created one.
Solution Features
RoboComEV was developed internally to provide our applications a built-in highly precise solution to record and observe application timing as a software logic analyzer capturing and converting the captured data into timing diagrams. The RoboComEV embedded visualization tool kit delivers high fidelity signal timing analysis of applications for embedded and desktop systems showing timing relationships with microsecond precision. The lightweight embedded code created application telemetry is used to precisely understand timing without affecting application operational behavior.
This analysis tool is used to perform debugging of C++ application code providing developers the features associated with VHDL/EDA/FPGA development following the Verilog or VHDL simulation model of data acquisition to memory storage followed by post-mortem interactive visualization of the generated dumpfiles. This class library generates dumpfiles in the Value Change Dump (VCD) format, an industry standard file format generated by most Verilog simulators.
Implementation
RoboComEV is a C++ based set of classes that are used to instrument a multi-threaded application to record precise real time signal timing and trace information for visualization and analysis. These class libraries provide “Lock-Free” and “Wait-Free” concurrent access to signal trace storage memory from multiple threads to avoid locking issues in multi-threaded programming (such a priority inversions) allowing application code to be instrumented without changing its behavior or timing.
RoboComEV logging brings to embedded Linux, desktop Linux, or Windows the development tools common to RTOS and FPGA developments providing a graphical view of real-time system events to visualize and better understand the behavior of real-time systems.
Nonintrusive
When developing the RoboComEV trace logger, we were mindful of the observer effect, where the act of instrumenting an application for tracing has the potential for changing the behavior of the application itself. To solve this issue, a custom non-locking non-waiting application program interface (API) was developed for adding trace entries into trace acquisition memory that allows multiple threads to generate trace information in a thread safe manner void of potential concurrency issues. Concurrency/thread safe lock-free programming is discussed in detail in the news post Lock-free Programming.
Results Capture Visualization
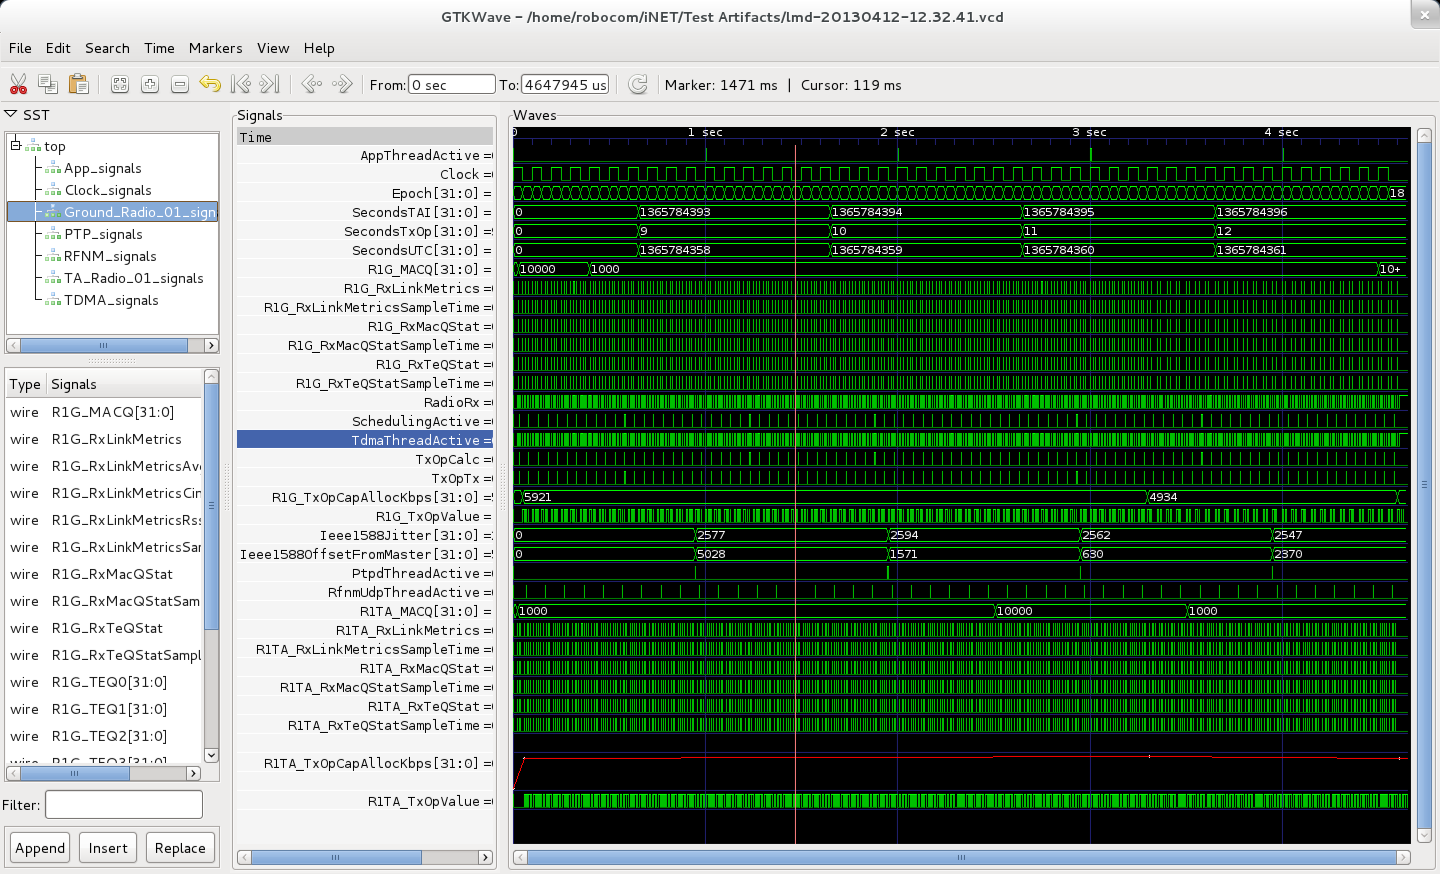
This technology can be used with any application which requires insight into thread timing and signal relationships. The VCD file generated by this tool set is viewable by any tool capable of viewing the VCD file type. We recommend the open source cross platform GTKWave application as shown in Figure 1. This application is available in source code format for building on Linux distributions, as formal .RPM and .DEB distributions for Linux, or as binaries for MAC OSX and Windows.
Figure 1: GTKWave User Interface
GTKWave Control
RoboComEV instrumentation results in the generation of trace content organized by trace parent type into folders that are visible in GTKWave’s left frame marked Signal Search Tree (SST). From the SST pane, individual signals are selected for viewing by dragging them from the SST pane to the Signals pane. The selected signals are then viewable in the Waves panes and the data type, format, and color used for viewing can be customized. Time spans can be measured and marked with this viewer using the vertical rules. The viewer allows scrolling and zooming in and out of the time base.